Avoiding Common PPC Reporting Mistakes That Cost You ROI
- Kyle Keehan

- Jan 8
- 6 min read
Introduction
Pay-per-click advertising lives and dies by reporting. Yet most PPC reports—especially those shared with clients, executives, or internal stakeholders—quietly distort reality. Not because the data is wrong, but because the reporting is.
Common PPC reporting mistakes don’t just create confusion. They lead to bad decisions: budgets shifted away from winning campaigns, underperforming ads left running too long, and optimization efforts aimed at the wrong metrics entirely.
This problem has become more pronounced as PPC ecosystems grow more complex. Between Google Ads, Microsoft Ads, Meta, YouTube, Performance Max, and blended attribution models, it’s easy to produce a report that looks polished while telling the wrong story.
The solution isn’t more spreadsheets or more screenshots from ad platforms. It’s building purpose-driven PPC reporting dashboards that surface issues early, flag inconsistencies automatically, and translate performance into actionable insight. This is exactly where Looker Studio excels—when it’s implemented correctly.
This guide breaks down the most common PPC reporting mistakes, explains why they happen, and shows how to avoid them using smart Looker Studio dashboard design.
Key Takeaway
Most PPC reporting failures aren’t caused by bad data—they’re caused by poor metric selection, inconsistent definitions, and dashboards that lack context or validation. A well-designed Looker Studio PPC dashboard acts as an early-warning system, highlighting errors, anomalies, and misleading trends before they cost you budget or credibility.
Mistake 1: Reporting on Spend Without Performance Context
One of the most frequent PPC reporting errors is isolating spend from outcomes. Reports show how much was spent yesterday, last week, or last month—but fail to tie that spend to conversions, revenue, or efficiency.
This creates two dangerous outcomes. First, high-spend campaigns appear “successful” simply because they’re active. Second, low-spend campaigns that quietly drive profitable conversions get ignored or cut.
Why this happens: Ad platforms spend the most visible metric. Many reports simply mirror platform views instead of reframing them around business outcomes.
How Looker Studio fixes it: In Looker Studio, spend should never appear alone. Every spend metric should be paired with at least one efficiency KPI:
Cost per conversion
ROAS
CPA vs target
Revenue per dollar spent
A DDH-style PPC dashboard places spend in the context of performance bands, not raw totals. Conditional formatting can instantly flag when spend rises faster than conversions—before it becomes a problem.
Visual to include: PPC Spend vs Conversions Alert DashboardHighlighted warning states when spend increases without a conversion lift.
Mistake 2: Using Platform Metrics Without Standardized Definitions
“Conversions” means something different depending on who you ask—and which platform you’re looking at.
Google Ads, GA4, Meta, and CRM systems all define conversions differently. When reports mix these sources without alignment, the result is inflated or contradictory performance reporting.
This mistake often surfaces in executive reviews when PPC reports don’t match revenue reports, creating mistrust in the data.
Why this happens: Teams rely on default platform definitions instead of creating a single source of truth.
How Looker Studio fixes it: Looker Studio allows you to standardize metrics at the reporting layer. Instead of relying on platform-specific conversion definitions, calculated fields can unify logic across sources.
For example:
Primary conversions only
Revenue-qualified conversions
Exclusion of micro-events
Once defined, these metrics are reused consistently across every chart and table. This prevents accidental mismatches and keeps reporting defensible.
Visual to include: Conversion Definition Warning Panel shows mismatched conversion counts across sources with alert icons.
Mistake 3: Focusing on Clicks Instead of Outcomes
Clicks are easy to measure—and easy to misinterpret.
High click volume often looks impressive in reports, but clicks alone say nothing about quality, intent, or profitability. Optimizing PPC based on clicks frequently leads to wasted spend on low-intent traffic.
Why this happens: Clicks are prominent in platform dashboards and feel tangible, especially to non-technical stakeholders.
How Looker Studio fixes it: Effective PPC dashboards de-emphasize clicks and elevate post-click performance:
Conversion rate
Cost per conversion
Revenue per session
Funnel drop-off indicators
Looker Studio enables multi-step funnel visuals that show where traffic fails after the click. This shifts optimization conversations away from traffic volume and toward conversion efficiency.
Visual to include: Post-Click Performance Warning FunnelHighlights high-click, low-conversion campaigns in red.
Mistake 4: Ignoring Time Lag and Attribution Windows
PPC doesn’t always convert instantly. Yet many reports evaluate campaigns on same-day or last-click results only, especially in B2B or high-consideration ecommerce environments.
This leads to premature decisions—pausing campaigns that haven’t had time to convert or reallocating budget too aggressively.
Why this happens: Default reports prioritize immediacy over accuracy.
How Looker Studio fixes it: Looker Studio supports date-offset comparisons and rolling windows. Dashboards can show:
Conversions within 7, 14, or 30 days
Spend vs delayed revenue
Assisted conversion influence
This allows PPC performance to be evaluated within realistic decision windows, not arbitrary reporting periods.
Visual to include: Delayed Conversion Impact Alert Chart shows spend today vs conversions over time with lag indicators.
Mistake 5: Reporting Averages Without Distribution
Average CPA, average ROAS, and average CPC hide problems.
A campaign with a “healthy” average CPA may actually contain multiple underperforming ad groups dragging down results—or one breakout winner masking several failures.
Why this happens: Averages are easier to explain than distributions.
How Looker Studio fixes it: Looker Studio makes it easy to visualize performance distribution, not just averages:
CPA by campaign
ROAS quartiles
Cost vs conversion scatter plots
These views expose outliers immediately and prevent averages from masking inefficiencies.
Visual to include: CPA Distribution Warning Scatter Plot outliers highlighted with alert labels.
Mistake 6: No Error Detection or Data Validation Layer
Most PPC dashboards assume the data is correct. That’s a mistake.
Tracking breaks. Conversions drop to zero. Spend spikes due to billing issues. Without alerts, these issues go unnoticed until the budget is wasted or reports are questioned.
Why this happens: Dashboards are built for reporting—not monitoring.
How Looker Studio fixes it: Advanced Looker Studio dashboards include error detection layers, such as:
Zero-conversion alerts
Sudden spend spikes
Conversion tracking drop-offs
Source mismatches
Conditional formatting and threshold rules turn dashboards into proactive monitoring tools, not passive reports.
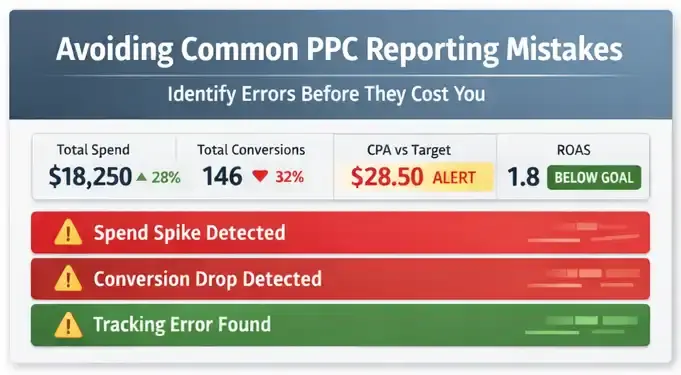
Visual to include: PPC Error & Alert DashboardWarning icons, red highlights, and status indicators for data integrity issues.
Mistake 7: Overloading Reports With Metrics That Don’t Drive Action
More metrics do not equal better insight.
Many PPC reports overwhelm stakeholders with dozens of KPIs, none of which clearly indicate the next course of action. This leads to analysis paralysis and delayed optimization.
Why this happens: Reports are built to “show everything” instead of answering specific questions.
How Looker Studio fixes it: Strong Looker Studio dashboards are built around decision-driven questions, such as:
Which campaigns should receive more budget?
Which ads should be paused or reworked?
Where is efficiency deteriorating?
Metrics are grouped by purpose, not by platform. This creates clarity instead of noise.
Why Looker Studio Is Ideal for PPC Error-Focused Reporting
Looker Studio isn’t just a visualization tool—it’s a reporting control layer. When used properly, it allows PPC teams to:
Standardize definitions across platforms
Blend ad data with GA4 and revenue sources
Surface anomalies automatically
Design client-ready dashboards that explain performance clearly
Unlike platform-native dashboards, Looker Studio is neutral. It doesn’t favor spend, impressions, or clicks—it favors truth, when configured correctly.
This makes it especially valuable for agencies, SMBs, and in-house teams that need reporting they can trust.
Frequently Asked Questions
What is the most common PPC reporting mistake?
The most common mistake is reporting on spend or clicks without tying them to conversions, revenue, or efficiency metrics like CPA and ROAS.
Why don’t Google Ads reports match GA4 or CRM data?
Each platform uses different attribution models and conversion definitions. Without standardization, discrepancies are unavoidable.
Can Looker Studio replace native ad platform reporting?
Yes—for performance analysis and decision-making. Native platforms are useful for execution, but Looker Studio excels at cross-platform insight.
How often should PPC dashboards refresh?
For most SMBs, a daily refresh is sufficient. Hourly refresh can be useful for high-spend or time-sensitive campaigns, but only if alerts are configured.
Do I need a separate dashboard for each ad platform?
Not necessarily. A blended PPC dashboard often provides better insight than isolated platform views, especially when focused on outcomes.
Final Thoughts
PPC reporting should protect your budget—not put it at risk.
Most reporting mistakes aren’t obvious until they’ve already caused damage. By the time performance issues appear in monthly summaries, the money is gone and the opportunity is lost.
A well-designed Looker Studio PPC dashboard shifts reporting from hindsight to foresight. It surfaces problems early, enforces consistency, and helps teams focus on actions that actually improve ROI.
If your PPC reports aren’t actively preventing mistakes, they’re not doing their job.
