Templates to Monitor Social Media Performance in Looker Studio
- Kyle Keehan

- Nov 3, 2025
- 4 min read
When it comes to understanding how your brand performs across social media channels, relying on platform-native analytics (like Meta Insights or Twitter Analytics) can feel like juggling disconnected puzzle pieces. Each network provides data in a different format, making it nearly impossible to get a unified picture of engagement, reach, and ROI. That’s where Looker Studio comes in. With the right template, you can bring all your Facebook, Instagram, and other platform metrics together into one visual, real-time dashboard.
In this article, we’ll explore how to use Looker Studio templates to monitor your social media performance, the key metrics to track, and how to customize dashboards for campaign reporting and engagement analysis.
Key Takeaway
Looker Studio templates let you centralize all your social media metrics — engagement, impressions, conversions, and ad spend — into a single, interactive dashboard. By connecting Facebook, Instagram, LinkedIn, and even TikTok data through connectors like Supermetrics or Porter, you can visualize content performance, track ROI, and refine campaign strategies without switching between apps. Templates save time, improve visibility, and help SMBs make data-driven marketing decisions faster.
Why a Centralized Social Media Dashboard Matters
Social media performance data is often scattered across multiple platforms. One post might go viral on Instagram but flop on Facebook — and unless you’re looking at both side by side, you miss the story.
With a centralized Looker Studio dashboard, you can:
Combine data from Facebook, Instagram, LinkedIn, TikTok, and YouTube.
Compare organic vs. paid engagement metrics.
Visualize trends in impressions, clicks, and conversions.
Track ROI from ad spend across campaigns.
Identify best-performing content types, hashtags, or audience segments.
The result? You get an executive-level view of your brand’s entire social footprint — updated automatically, every day.
Metrics to Track for Social Media Success
Every platform has its nuances, but the following metrics are universal indicators of social media performance:
1. Engagement Metrics
Likes, comments, shares, saves
Engagement rate (%): (Total engagements ÷ total impressions) × 100
Follower growth rate
2. Reach and Impressions
Total reach and impressions per platform
Unique users reached per post
Frequency (how many times a user sees your content)
3. Traffic and Conversions
Click-through rate (CTR)
Landing page sessions (from GA4 or UTM tracking)
Social-assisted conversions
4. Ad Performance
Cost per click (CPC)
Cost per thousand impressions (CPM)
Cost per acquisition (CPA)
Return on ad spend (ROAS)
5. Content Insights
Top-performing posts by engagement
Hashtag performance
Post type comparison (carousel vs. video vs. story)
By combining these KPIs in Looker Studio, you can instantly identify which campaigns deliver the best engagement and ROI — and where to focus your creative energy next.
Building a Looker Studio Template for Social Media
Creating your social media dashboard doesn’t require coding or complex data modeling. Here’s how to set it up:
Step 1: Connect Your Data Sources
Use native connectors or tools like Supermetrics, Windsor.ai, or Porter Metrics to connect Facebook Insights, Instagram Business, and GA4. If you run paid campaigns, add your Meta Ads and Google Ads data for a blended view of cost vs. performance.
Step 2: Use a Pre-Built Template
Data Dashboard Hub and similar providers offer ready-to-use Looker Studio templates. These templates already include visualizations for:
Engagement rate trends
Audience growth by platform
Campaign ROI comparison
Content performance heatmaps
Just authenticate your data sources, and the dashboard populates automatically.
Step 3: Customize the Visuals
Add your logo, change brand colors, and tailor dimensions to your needs:
Use time-series charts for engagement over time.
Add scorecards for quick KPIs (followers, clicks, spend).
Include tables with filters to drill into specific posts or campaigns.
Create cross-platform comparison views for quick insights.
Measuring the Impact of Your Social Media Dashboards
Once your dashboard is live, it’s essential to measure its effectiveness. Use Looker Studio to track:
Content trends: Identify how engagement evolves week-to-week.
Traffic impact: Link UTM-tagged URLs to GA4 data to quantify conversions.
Ad performance: Compare spend vs. engagement rate to refine targeting.
Efficiency gains: Measure time saved vs. manual reporting.
By reviewing this data regularly, you can validate whether your reporting setup provides actionable insights — or if adjustments are needed to better align with business goals.
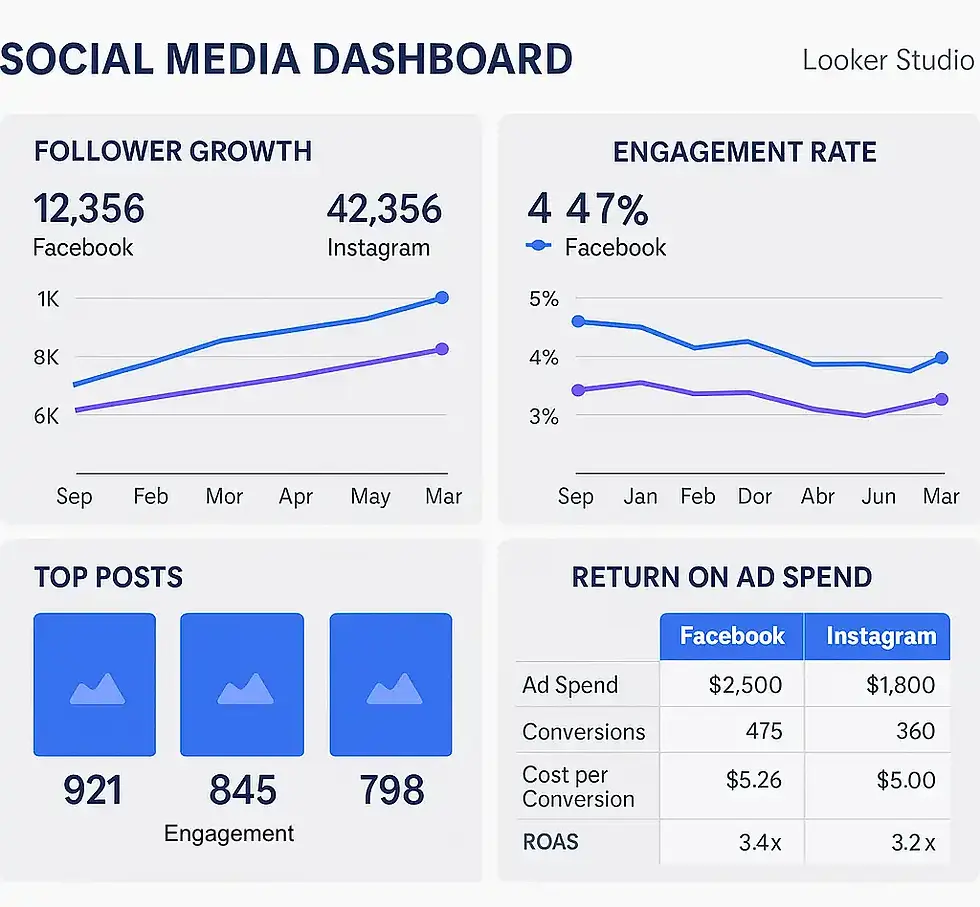
Example: Facebook + Instagram Dashboard Mockup
Using Looker Studio to Share Social Media Reports
One of the platform’s greatest strengths is collaboration. You can:
Schedule automated email delivery of performance reports.
Create viewer-level access for marketing teams or clients.
Embed the dashboard directly into presentations or client portals.
This transforms Looker Studio into a living, shareable reporting hub — perfect for agencies, marketing managers, and CMOs who want to monitor KPIs without logging into multiple tools.
Frequently Asked Questions (FAQ)
Q1: Which connectors should I use for Facebook and Instagram data?
You can use native Meta connectors or third-party tools like Supermetrics, Porter, or Windsor.ai, depending on your access level and reporting needs.
Q2: Can I include TikTok or LinkedIn metrics in the same dashboard?
Yes — most connectors allow you to blend these platforms into one report, creating a cross-network analytics view.
Q3: How often does the data update?
Most connectors refresh daily, though paid plans may allow hourly updates for real-time campaign monitoring.
Q4: How do I track conversions from social campaigns?
Use UTM parameters and connect your GA4 property to track social-assisted conversions in Looker Studio.
Q5: What’s the best visualization for engagement?
A combination of time-series charts and bar graphs works best — showing both total engagement and rate trends over time.
