Demystifying the Maze: A Comprehensive Guide to Website Analytics Reports
- Kyle Keehan

- Jul 18, 2024
- 5 min read
Updated: Jan 14, 2025
In today's digital landscape, a website is often the cornerstone of a business's online presence. But simply having a website isn't enough. You need to understand how visitors interact with your site, what content resonates, and ultimately, how it contributes to your overall goals. This is where website analytics reports come in.
This guide equips you with the knowledge and tools to navigate the world of website analytics reports. We'll delve into the essential metrics you need to track, explore different report types, and decipher valuable insights to optimize your website's performance.
Website Analytics Report Podcast
Unveiling the Metrics: What Gets Measured Gets Managed
Website analytics reports offer a treasure trove of data, but focusing on the right metrics is key. Here's a breakdown of some crucial ones:
Traffic Acquisition: Understanding Your Visitors' Journey
This section reveals where your website visitors come from. It includes metrics like:
Sessions: The total number of visits to your website.
Users: The number of individual visitors to your website.
Organic Traffic: Visitors who arrive through search engines.
Paid Traffic: Visitors acquired through paid advertising campaigns.
Referral Traffic: Visitors who click on links from other websites.
Direct Traffic: Visitors who type your website address directly into their browser.
User Engagement: Measuring Interaction Quality
This section sheds light on how visitors interact with your website. Key metrics include:
Pageviews: The total number of individual pages viewed during a session.
Average Session Duration: The average amount of time users spend on your website per session.
Bounce Rate: The percentage of visitors who leave your website after viewing only one page.
Exit Pages: The last page a user views before leaving your website.
Conversions: Tracking Goal Achievement
This section tracks how visitors take desired actions on your website, such as making a purchase, signing up for a newsletter, or downloading a file. Examples of conversion metrics include:
Goal Completions: The number of times visitors complete a specific action on your website.
Conversion Rate: The percentage of visitors who complete a desired action.
E-commerce Revenue: The total revenue generated through online sales on your website (if applicable).
A Report for Every Need: Tailoring Your Website Analytics Report
There's no one-size-fits-all approach to website analytics reports. Different reports cater to specific objectives. Let's explore some common report types:
Acquisition Reports: Uncovering Traffic Sources
These reports delve deeper into your traffic sources, helping you understand which channels are most effective in driving visitors to your website. You can analyze organic search performance, paid advertising campaigns, and referral traffic sources. This helps you optimize your marketing strategies and allocate resources effectively.
Behavior Reports: Analyzing Navigation Patterns
These reports unveil how visitors navigate your website. By analyzing metrics like pageviews, bounce rate, and average session duration, you can identify which pages are engaging and which ones need improvement. You can also understand user flow and identify areas where visitors might be dropping off. This allows you to optimize your website structure and content for a better user experience.
Conversion Reports: Measuring Success
These reports track user actions that contribute to achieving your website's goals. You can analyze conversion rates for specific actions like purchases, form submissions, or newsletter sign-ups. By tracking goals and conversion funnels, you can identify bottlenecks and optimize your website to improve conversions.
Custom Reports: Tailored Insights
Many analytics platforms allow you to create custom reports tailored to your specific needs. You can combine different metrics and dimensions to gain deeper insights into specific aspects of your website's performance. This can help analyze user behavior on specific product pages or track the success of marketing campaigns.
Beyond the Numbers: Transforming Data into Actionable Insights
Numbers on a report are valuable, but the true power lies in transforming them into actionable insights. Let's explore how to interpret your website analytics reports:
Identify Trends
Look for patterns and trends over time. Are there seasonal fluctuations in traffic? Are specific marketing campaigns driving traffic spikes? Analyzing trends helps you understand long-term performance and make informed decisions.
Benchmarking
Compare your website's performance against industry benchmarks or similar websites. This helps you gauge your relative standing and identify areas for improvement.
Segmenting Data
Don't just look at overall website data. Segment your data by user demographics, device type, location, or referral source. This unveils granular insights into how different user groups interact with your website.
Focus on Action
Don't get bogged down in the data. Use your insights to formulate actionable strategies. For example, if a particular page has a high bounce rate, explore ways to improve its content or design.
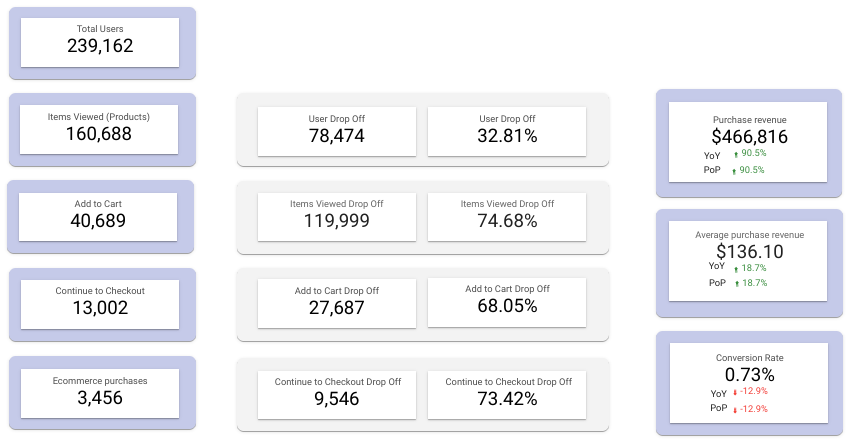
Conversion and Drop-Off Funnel: Pinpointing Opportunities
The conversion funnel is a critical framework for understanding how visitors progress through your site toward a goal. Here's how you can analyze and optimize it:
Funnel Stages
Awareness: Visitors land on your site through various channels.
Consideration: They explore your content, products, or services.
Decision: They proceed to checkout, form submission, or other goal-related actions.
Retention: Returning customers or users.
Analyzing Drop-Offs
Identify stages where significant numbers of users exit the funnel.
Examine possible reasons: confusing navigation, lack of trust signals, or technical issues.
A/B test solutions to determine what works best.
Real-World Case Study: How Company X Used Website Analytics to Boost Conversions
Company X, a mid-sized e-commerce business specializing in home decor, struggled with a high bounce rate and a low conversion rate on its product pages. After implementing Google Analytics and using custom reports, they identified key pain points in their user journey:
Problem Identification:
High drop-offs on mobile devices.
Slow loading times for image-heavy pages.
Confusing navigation, especially on the checkout page.
Actions Taken:
Optimized page load speeds by compressing images and enabling browser caching.
Redesigned the mobile interface to improve usability and navigation.
Streamlined the checkout process by reducing the number of steps and adding a progress indicator.
Results Achieved:
Reduced bounce rate by 25%.
Increased mobile conversions by 40%.
Overall revenue growth of 18% within three months.
This case study highlights the power of actionable insights derived from analytics reports. By addressing specific pain points, Company X was able to enhance user experience and achieve measurable business outcomes.
Key Takeaways
Website analytics reports are essential for understanding visitor behavior and optimizing website performance.
Focus on key metrics: traffic acquisition, user engagement, and conversions.
Use tailored reports like acquisition, behavior, conversion, and custom reports to gain actionable insights.
Transform raw data into strategies by identifying trends, benchmarking, and segmenting.
Analyze conversion funnels to pinpoint and address drop-off points effectively.
FAQ
1. What is the most important metric to track in website analytics?
The most important metric depends on your goals. For traffic, focus on sessions and users. For engagement, consider bounce rate and average session duration. For sales, prioritize conversion rates and e-commerce revenue.
2. How often should I review my website analytics reports?
Reviewing reports weekly is a good practice for tracking short-term trends. Monthly reviews can help identify broader patterns and inform strategic decisions.
3. Can I integrate website analytics with other tools?
Yes, many analytics platforms integrate with tools like Google Ads, CRM systems, and email marketing platforms for a more comprehensive view of performance.
4. How do I improve a high bounce rate?
Analyze pages with high bounce rates for potential issues like slow loading times, irrelevant content, or poor design. Test improvements to reduce the bounce rate.
5. What is the role of custom reports in analytics?
Custom reports allow you to tailor analytics to specific goals or campaigns, combining unique metrics and dimensions for deeper insights.
6. What is a drop-off in a conversion funnel?
A drop-off occurs when users leave the site or abandon a process before completing a goal, such as leaving a checkout process midway.
7. How do I track user behavior across devices?
Use cross-device tracking features in analytics platforms to monitor how users interact with your site on mobile, desktop, and other devices.
By understanding and leveraging these insights, you can continuously improve your website's effectiveness, ensuring it remains a powerful tool for achieving your business objectives.
