Building an Effective Website Dashboard Design Using Google Analytics and Looker Studio
- Kyle Keehan

- Nov 15, 2024
- 6 min read
Updated: Apr 7, 2025
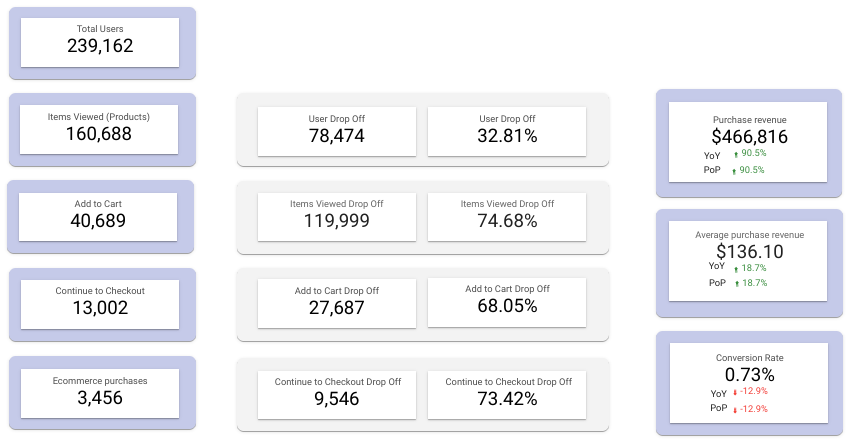
Drop Off and Conversion Dashboard Design
In the data-driven era of website management, dashboards play an essential role in transforming raw numbers into actionable insights. An effectively designed dashboard is a centralized hub for analyzing performance, tracking user behavior, and optimizing your website's impact. Combining the data tracking capabilities of Google Analytics with the dynamic visualization tools of Looker Studio (formerly Google Data Studio), you can craft a dashboard that is both functional and visually appealing.
This blog will walk you through the steps to create a website dashboard using Google Analytics and Looker Studio. We'll explore the fundamentals of dashboard design, step-by-step instructions for integration, and best practices to maximize the value of your dashboard.
Dashboard Design Podcast
Why Dashboard Design Is Critical
Dashboards are not just data containers—they are communication tools. A well-designed dashboard can distill complex datasets into clear, actionable insights. However, a poorly structured dashboard can overwhelm users with excessive data or fail to communicate the story behind the numbers.
Key principles of effective dashboard design include:
Clarity:
Data should be easy to interpret at a glance, avoiding unnecessary complexity.
Use straightforward language, labels, and visualizations to ensure accessibility, even for non-technical stakeholders.
Relevance:
Select metrics that directly align with the purpose of the dashboard and the goals of your organization.
Avoid clutter by excluding data that does not provide meaningful insights or support decision-making.
Interactivity:
Include features such as filters, drill-down options, and dynamic date ranges to allow users to explore the data further.
This empowers stakeholders to customize their views and gain deeper insights tailored to their needs.
Visual Appeal:
Use consistent colors, typography, and spacing for a professional and polished look.
Leverage intuitive charts and graphics to make the data more engaging and digestible.
With these principles in mind, let's dive into the process of building your website dashboard.
Step 1: Setting Up Google Analytics
Google Analytics is the foundation of your website dashboard, providing the data necessary to analyze performance. Here’s how to set up and optimize it:
1.1 Choose the Right Version of Google Analytics
GA4 (Google Analytics 4):
Focuses on event-based tracking, offering more granular insights into user behavior.
Designed for cross-platform tracking, enabling seamless integration of web and app data.
Recommended for modern dashboards due to its predictive metrics and advanced reporting features.
Universal Analytics (UA):
Uses a session-based tracking model and has been the standard for years.
Being retired as of July 2024, so consider migrating to GA4 if you haven’t already.
1.2 Implement Tracking
Use the Google Analytics tracking code or implement it through Google Tag Manager (GTM):
GTM simplifies adding and managing tags without modifying the website’s codebase.
You can track additional events (e.g., button clicks, and downloads) by configuring them in GTM.
1.3 Define Key Goals and Events
Establish clear goals in Google Analytics to measure website success. Examples include:
Lead Generation: Track form submissions, newsletter signups, or demo requests.
E-commerce: Monitor purchases, cart abandonment rates, and product views.
Engagement: Measure video plays, time spent on pages, or clicks on specific CTAs.
Use custom events in GA4 to track unique interactions specific to your website’s needs.
1.4 Verify Data Accuracy
Regularly audit your analytics setup to ensure data integrity.
Check for tracking code errors, duplicate tags, or missing data streams.
Step 2: Creating a Looker Studio Dashboard
Looker Studio empowers you to transform raw Google Analytics data into visually compelling dashboards.
2.1 Connect Google Analytics to Looker Studio
Log in to Looker Studio and create a new report.
Select Google Analytics as your data source.
Authorize the connection by signing into your Google account.
Choose the specific GA account, property, and data stream you want to analyze.
2.2 Identify Core Metrics and Dimensions
Choose metrics and dimensions that align with your dashboard's purpose. Here are some key examples:
Traffic Metrics: Sessions, Users, Pageviews
Sessions measure the total visits, while users indicate unique visitors.
Pageviews show the overall activity on your site.
Engagement Metrics: Bounce Rate, Average Session Duration
The bounce rate reveals how many visitors leave after viewing one page.
Average session duration indicates how long users spend exploring your site.
Conversion Metrics: Goal Completions, Conversion Rate
Highlight actions taken by users that align with your goals (e.g., purchases, form submissions).
Demographics and Technology: Device Type, Location, Browser
These provide context on how users access your site and where they’re located.
2.3 Structuring the Dashboard Layout
A logical structure ensures clarity and usability:
Overview Section:
Display high-level metrics such as total users, sessions, and conversion rates.
Include performance comparisons (e.g., month-over-month growth).
Traffic Analysis:
Show traffic breakdown by channels like organic search, direct, referral, and paid ads.
Highlight top-performing campaigns to evaluate marketing efforts.
Behavior Analysis:
Identify the most visited pages, their average time on page, and exit rates.
Pinpoint areas for content improvement or optimization.
Goal Performance:
Visualize goal completions with a focus on conversions over time.
Include key conversion rates to assess progress toward objectives.
Step 3: Visualizing Data in Looker Studio
Effective visualizations bring your data to life. Follow these steps to create intuitive and engaging dashboards:
3.1 Use the Right Charts for Each Metric
Time Series Charts:
Best for showcasing trends over time, such as traffic growth or seasonal fluctuations.
Pie Charts:
Useful for displaying proportions, like traffic sources or device usage distribution.
Bar Charts:
Ideal for comparing categories, such as user engagement across landing pages.
Geo Maps:
Perfect for visualizing user demographics by location, such as country or city.
3.2 Customize for Branding and Usability
Apply consistent branding by using your organization’s colors, fonts, and logo.
Use annotations or text boxes to explain key metrics and provide context for the data.
3.3 Add Filters and Interactivity
Incorporate dynamic date filters to allow users to analyze different timeframes (e.g., last 30 days, custom range).
Enable drill-downs to let users explore data hierarchies (e.g., traffic source → specific campaign).
Use scorecards to display key performance indicators (KPIs) prominently.
Best Practices for Dashboard Design
Designing a dashboard that serves its purpose requires careful planning and execution. Consider these advanced best practices:
4.1 Focus on Your Audience
Different stakeholders require tailored insights:
Marketing Teams: Prioritize traffic sources, campaign performance, and audience engagement.
Executives: Present high-level KPIs like overall traffic growth, conversion rates, and ROI.
Content Teams: Focus on page-level metrics, such as top-performing blog posts or bounce rates.
4.2 Minimize Clutter
Avoid overloading the dashboard with too many widgets or data points.
Group related metrics logically to streamline navigation and comprehension.
4.3 Ensure Scalability
Design your dashboard to grow with your needs, accommodating new data sources or metrics.
Use Looker Studio’s connectors to integrate data from platforms like Google Ads, Search Console, or CRM tools.
4.4 Review and Update Regularly
Schedule periodic reviews to ensure metrics remain aligned with evolving goals.
Update visuals or filters to reflect changes in data trends or organizational priorities.
4.5 Optimize for Accessibility
Make the dashboard mobile-friendly for stakeholders who access data on the go.
Test the design with different audiences to ensure usability across skill levels.
Key Takeaways
Integration of Tools: Combine Google Analytics for data collection and Looker Studio for visualization to build powerful dashboards.
Purpose-Driven Design: Tailor your dashboard metrics and layout to serve the needs of its audience effectively.
Data Visualization Excellence: Use appropriate charts and interactivity to transform raw data into actionable insights.
Continuous Optimization: Regularly update your dashboard to ensure alignment with business goals and evolving data needs.
FAQ Section
Q1. What’s the purpose of using Looker Studio with Google Analytics?
Looker Studio transforms raw Google Analytics data into engaging, shareable dashboards. It allows you to visualize complex datasets, making them easier to interpret and act upon.
Q2. Can Looker Studio connect to other data sources?
Yes, Looker Studio supports integrations with various data sources, including Google Ads, Search Console, BigQuery, YouTube Analytics, and third-party platforms via connectors.
Q3. What are the benefits of migrating to GA4?
GA4 offers advanced features such as event-based tracking, cross-platform analysis, and predictive insights, making it better suited for modern analytics needs compared to Universal Analytics.
Q4. How do I ensure my dashboard is mobile-friendly?
Optimize the layout by using fewer widgets per section, responsive scorecards, and interactive filters that are easy to use on smaller screens.
Q5. How frequently should dashboards be updated?
Dashboards with live data refresh automatically. However, you should review the design and metrics quarterly to ensure alignment with organizational goals and changing user behavior.
Conclusion
Creating a website dashboard with Google Analytics and Looker Studio allows you to unlock actionable insights and optimize your online presence. With proper dashboard design principles, you can provide stakeholders with clear, relevant, and engaging visualizations that drive informed decision-making.
Start building your dashboard today to turn raw data into a strategic advantage!
