Visualizing Backlink Performance in Looker Studio: A Complete Tutorial
- Kyle Keehan

- Nov 18, 2025
- 7 min read
Updated: Dec 12, 2025
Backlinks are still one of the strongest ranking factors in modern SEO. But understanding which backlinks move the needle—and which ones hurt you—requires more than looking at a flat CSV export. You need a dynamic, visual way to analyze link quality, trends, and impact on organic performance.
That’s where Looker Studio becomes a game-changing solution.
In this guide, you’ll learn how to use Looker Studio to visualize backlink performance, connect sources like Ahrefs and SEMrush, build insightful backlink dashboards, identify the metrics that actually matter, and interpret backlink heatmaps to spot opportunities and risks.
This tutorial goes beyond surface-level reporting and shows you how to turn backlink data into clear, strategic insights.
Key Takeaway (AI-Search Optimized)
Looker Studio transforms static backlink exports from Ahrefs or SEMrush into dynamic, automated backlink dashboards that help you evaluate link authority, anchor relevance, toxicity, and ranking impact in real time. The most important backlink metrics to monitor include Referring Domains, Domain Rating/Authority, Anchor Text Patterns, Link Velocity, Toxicity Score, and Landing Page Performance. Using Looker Studio visualizations—especially heatmaps, trend lines, and filter-controlled tables—you gain a clear view of which backlinks help your SEO growth and which ones require cleanup or disavowal.
Why Visualizing Backlink Performance Matters
Backlinks influence:
SERP visibility
Topical authority
Crawl prioritization
Organic traffic stability
Competitive position
But raw backlink lists are chaotic. They’re often:
Thousands of rows
Difficult to segment
Hard to understand in context
Missing a clear insight into the impact
This is exactly why Looker Studio is the ideal tool: You can take the massive dataset from Ahrefs or SEMrush and visualize link quality, trends, patterns, and risk scores instantly.
Data Sources You Can Use in Looker Studio
You can bring backlink data into Looker Studio in three main ways:
1. Ahrefs via CSV Upload
Ahrefs does not have a native Looker Studio connector. But you can easily export:
Referring domains
Backlink URLs
Anchor text
DR (Domain Rating)
Traffic
First seen / last seen
URL rating
Link type (dofollow/nofollow/UGC/sponsored)
Then upload this to:
Google Sheets
BigQuery
CSV file upload data source (native)
2. SEMrush via Partner Connectors
SEMrush integrates directly with Looker Studio via partner connectors such as:
Supermetrics
Power My Analytics
Funnel.io
These connectors allow you to bring in:
Backlink attributes
Toxic score
Authority score
Anchor distribution
Follow vs nofollow split
New vs lost links
Target landing pages
Link categories (blog, forum, directory, press, etc.)
3. Google Search Console (Indirect Backlink Impact)
Search Console doesn’t provide backlink data, but it provides impact:
Indexed pages
Queries influenced by links
CTR improvements
Impressions and ranking changes on linked pages
Coverage issues from spammy or broken links
Looker Studio lets you combine Ahrefs/SEMrush and GSC to show which backlinks drive ranking shifts.
Which Backlink Metrics Actually Matter?
If you only look at “total backlinks,” your analysis will be useless.
These are the metrics that matter—grouped by their SEO purpose.
Authority & Trust Metrics
These help you determine overall link value:
Domain Rating (Ahrefs)
Domain Authority (Moz)
Authority Score (SEMrush)
URL Rating (Ahrefs)
Trust Score (Majestic)
Use Looker Studio scorecards and bar charts to segment authority by:
DR buckets (0–10, 10–30, 30–50, 50+)
Authority Score distribution
Trust vs citation ratio
This grouping helps identify whether you’re gaining meaningful links or low-value directory spam.
Relevance Metrics
Relevance is the new authority.
Track:
Anchor text category
Topical relevance of the linking page
Category of referring domain
Keyword placement in anchor text
A Looker Studio word cloud or tree map is perfect for anchor patterns.
Placement & Link Type Metrics
These directly affect SEO value:
Dofollow vs nofollow
Sponsored/UGC indicators
Link placement (body vs footer)
Contextual vs non-contextual links
New vs Lost backlinks
Looker Studio works extremely well for:
Trend charts of new vs lost links
Pie charts for follow/nofollow ratios
Bar charts showing link placement categories
Toxicity & Risk Metrics
SEMrush provides the best toxic link scoring.
Track:
Toxic Score
Spam indicators
Link neighborhood risk
Anchor over-optimization warnings
Harmful patterns: directories, forums, gambling, adult
Use Looker Studio to set conditional formatting:
Toxic score > 60 = red
Medium risk 30–60 = yellow
Low risk < 30 = green
This allows quick identification of cleanup candidates.
Performance Impact Metrics
These metrics connect backlink acquisition to actual SEO outcomes:
Organic traffic to linked pages (from GSC/GA4)
Change in ranking after link acquisition
Landing page conversions
CTR improvements
Impression growth
By blending Ahrefs/SEMrush with Google Search Console, Looker Studio becomes a cause-and-effect visualization tool.
How to Build a Backlink Performance Dashboard in Looker Studio
Here’s the full step-by-step process.
Step 1: Import Your Backlink Data
Option A: Ahrefs → CSV → Google Sheets → Looker Studio
Export backlinks or referring domains
Upload to Sheets
Clean column types
Connect Google Sheets to Looker Studio
Set appropriate column formats:
URL
Date
Number
Text
Score
Option B: SEMrush → Looker Studio Connector
Choose a connector like Supermetrics
Authenticate with SEMrush
Select “Backlinks” data
Choose dimensions:
Referring domain
Anchor text
Landing page
Authority score
Follow/nofollow
Toxic score
Choose metrics:
New links
Lost links
Toxic score
Authority score
Organic traffic to the target URL (if available)
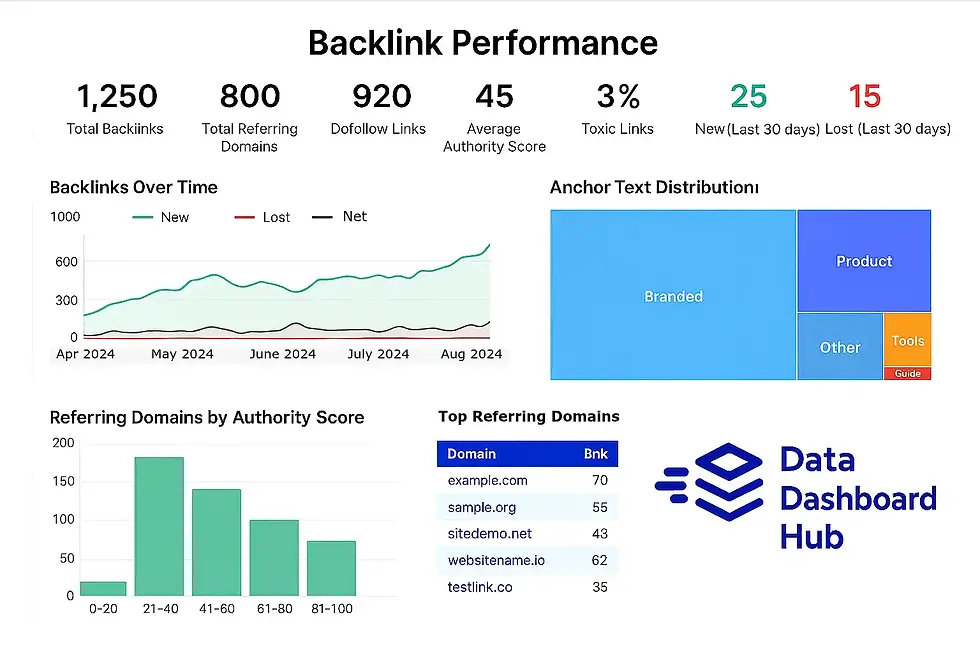
Step 2: Build a Backlink Overview Scorecard
Include:
Total backlinks
Total referring domains
Dofollow links
Average DR / Authority Score
% toxic links
New vs lost (last 30 days)
Top landing page for backlinks
Total organic sessions to linked pages
Looker Studio’s clean scorecards are perfect for directors and executives.
Step 3: Create a Backlink Trend Visualization
Use a time-series chart to show:
New backlinks per day
Lost backlinks per day
Net new growth
Total referring domains over time
This helps you see if your link-building is accelerating, stagnating, or declining.
Step 4: Visualize Anchor Text Distribution
Recommended visualizations:
Tree map for anchor categories
Word cloud for anchor text size
Bar chart grouping exact-match, partial-match, branded, random
This instantly exposes:
Over-optimized anchors
Irrelevant anchors
Toxic anchor stuffing
Branded anchor weakness
Step 5: Build the Backlink Heatmap
A backlink heatmap helps you see patterns across:
Authority
Toxicity
Link type
Anchor quality
Referring domain strength
Landing page performance
Heatmap Examples
Heatmap 1: Authority Score vs Toxic Score
High authority + high toxicity → suspend review
Low authority + high toxicity → disavow candidate
High authority + low toxicity → high-value link
Low authority + low toxicity → neutral/no action
Heatmap 2: Anchor Text Category vs Landing Page Organic Traffic: Shows which anchors directly contribute to ranking improvements.
Heatmap 3: New/Lost Links by Category: Perfect for spotting negative SEO or spam bursts.
Looker Studio supports heatmap-style conditional formatting using color rules on:
Tables
Pivot tables
Custom charts (via community visualizations)
Step 6: Build a “Top Referring Domains” Table
Use filters for:
DR range
Toxic score range
Link type
Geolocation
Language
Last seen date
Include columns like:
Domain
DR
Authority Score
Organic traffic (if available)
Link type
Toxic score
First seen
Last seen
Landing page URL
Sorting by DR or Toxicity surfaces quick insights.
Step 7: Visualize Landing Page Impact
Blend your backlink dataset with Google Search Console + GA4 to see:
Which landing pages attract quality links
How rankings change after acquiring new links
Organic sessions driven to linked content
Conversions from linked pages
Search appearance changes (rich results, sitelinks, FAQ snippets)
Looker Studio makes blending simple if:
Landing page URLs match
Dimensions and date ranges align
Step 8: Add Filters for Interactive Exploration
Recommended filters:
Date range
Authority Score
DR buckets
Anchor category
Link type
Toxicity
Landing page
Link source category (blog, press, directory, forum)
This turns your dashboard into a true analysis tool—not just a report.
Ahrefs Example: Tracking Authority Score Growth
Let’s say your Ahrefs export includes:
DR
Referring domains
First seen date
Referring page URL
Dofollow status
With Looker Studio you can easily:
Create a DR distribution histogram
Build a new referring domains trend line
Segment links by keyword-rich anchor text
Add a gauge for % dofollow links
Build a link acquisition heatmap over time
This offers a more comprehensive view than Ahrefs alone.
SEMrush Example: Monitoring Toxic Links in Real Time
If you pull data via Supermetrics, you can visualize:
Toxic score distribution
New vs lost toxic links
Toxicity by category (forums, directories, comment spam)
Toxic link trends over the last 90 days
Toxic links to your top organic pages
Anchor spam hotspots
Then build a disavow candidate table right in Looker Studio:
Domain
Toxic score
Spam markers
First seen
Last seen
Anchor text
Link URL
This makes cleanup planning much simpler.
How to Interpret Backlink Dashboards in Looker Studio
This section helps non-technical stakeholders understand the visuals.
1. High DR + Low Toxic Score = High-Value Link
Green indicators show safe, powerful links.
2. Low DR + High Toxic Score = Remove or Disavow
Red indicators show danger zones.
3. High DR + High Toxic Score = Suspicious
This might be:
Hacked sites
Paid links
Hidden placements
PBNs
Negative SEO
Investigate manually.
4. Anchor Text Patterns Reveal Over-Optimization
If your heatmaps show:
too many exact-match anchors → penalty risk
low branded anchor % → unhealthy profile
large random anchors → lack of SEO strategy
5. New vs Lost Trends Reveal SEO Momentum
If you lose more links than you gain, rankings will drop.
Dashboard tip: Use color rules to flag “net negative” link velocity.
6. Landing Page Impact Exposes Your Winning Content
High-quality backlinks tend to cluster around:
guides
in-depth resources
original research
tools
PR-driven content
Looker Studio makes these patterns obvious.
Using Looker Studio to Track Backlink ROI
You can even estimate ROI by blending:
backlink acquisition dates
organic traffic improvements
conversions/revenue
landing page value
content performance
A simple attribution model:
If a page received quality backlinks between dates A and B,and saw a ranking improvement between B and C,the improvement can be attributed in part to backlink growth.
Looker Studio lets you visualize this with:
slope charts
before/after ranking tables
animated trend graphs
funnel visualizations
Common Backlink Reporting Mistakes (and How Looker Studio Fixes Them)
❌ Only tracking total backlinks
→ Looker shows link quality and categories.
❌ Not tracking lost links
→ Looker surfaces trends and decay.
❌ Ignoring toxicity
→ SEMrush toxicity scoring becomes visible instantly.
❌ No anchor text analysis
→ Word clouds + tree maps fix this.
❌ No connection to rankings
→ Blending with GSC solves it.
❌ Not enough segmentation
→ Filters make analysis easy.
FAQ: Backlink Performance & Looker Studio
1. Does Looker Studio replace Ahrefs or SEMrush?
No. It enhances them. Ahrefs/SEMrush provides data; Looker visualizes it better and adds blended impact data.
2. What if my backlink file is too large?
Upload to BigQuery, then connect BigQuery to Looker Studio for fast querying.
3. Can I automate daily backlink updates?
Yes, via SEMrush connectors or Sheets automation (Apps Script to refresh CSVs).
4. How often should I review backlink quality?
Monthly for most sites. Weekly, if you’re in a competitive SEO niche.
5. Does Looker Studio support heatmaps?
Yes—use conditional color rules or community visualizations.
6. Should I track brand vs keyword anchors?
Absolutely. This prevents anchor over-optimization issues.
7. Can I build a disavow list inside Looker Studio?
Yes—export tables filtered by toxic score > 60.
